How's the House Market in Hampton Roads?
- Adam Garrett
- Jan 2, 2025
- 10 min read
Updated: Jun 22
The market in Hampton Roads is in a relatively good place. Home values are growing, but not growing at too rapid of a rate that would stimulate future crash concerns. Home values are also still quite affordable & below the Virginia median price and the national median price. Inventory is relatively low. In this article, I'll be sharing via graph form more on the current state of the market, and focusing as well on historic and recurring trends. The below is best viewed on a desktop.

Indirect Factors
What Other Factors Beyond Typical Real Estate Market Statistics in Hampton Roads Contribute to Positive Market Conditions?
There are a number of factors involved, but here is a small sampling:
Plenty of things to do in the area
Limited snow, coastal access but a better degree of insulation from hurricanes than more southern states while maintaining relatively warm waters & warmer air vs more northern states
Home to some of the best-rated hospitals in Virginia, with another Riverside hospital being built in Isle of Wight County (a 1st in IOWC) that's scheduled to open in early 2026.
Home to some well-rated public school districts, including the following when considering Niche school district rankings in VA as of 6/9/25:
York County Schools, ranked number 3 and at a much lower median price point for homes than the 2 higher-rated districts, Arlington & Falls Church.
Virginia Beach Schools, ranked number 5 in the state, & at a much lower median price point than Arlington, Falls Church, & Loudoun County, which is ranked number 5.
Additional state rankings in the top 25 in Virginia located in Hampton Roads on Niche include:
While it doesn't get as much love from Niche, SchoolDigger's algorithm puts Poquoson City public schools at number 4 in VA, with the following behind it as of 6/9/25 for school year 2023-2024 among the top 40 in VA in Hampton Roads:
York County at 5
Virginia Beach at 27
Chesapeake at 29
Home to some well-rated private schools, including among the top 50 private schools in VA by Niche as of 6/9/25:
Norfolk Academy, ranked number 9, with a significantly lower median house price in Norfolk than the locations of the top 8 (Reston, Chantilly, Arlington, Woodberry Forest, Mclean, & Alexandria)
Home to strong tourism locations for history and fun, especially in Virginia Beach, Norfolk, Yorktown, James City County, & Williamsburg, the latter of which includes a large theme park (Busch Gardens), outdoor water park (Water Country USA), & indoor water park/hotel (Great Wolf Lodge).
A robust transportation system, including:
Roads & interstate with many areas toll-free
Commercial Airports
Norfolk's international airport has the 3rd most direct destinations of any airport in VA per Flight Connections, & the counties with the 2 highest direct destination airports in VA have significantly higher median prices than any county in Hampton Roads.
Newport News Airport is 1.5 miles away from the Newport News transportation center, which open in 2024, & is a stop on Amtrak and the hub for bussing in Newport News.
Another airport, Richmond International, is closer to some parts of Hampton Roads than Norfolk Airport. Richmond has the 4th most direct destinations of any airport in VA (& in excess of 4x more than the 5th biggest direct destination airport in Virginia) per flight connections.
Plentiful bussing options in some cities of Hampton Roads & light rail in Norfolk
Home to a strong military presence, 1 of only 2 full-fledged VA hospitals in VA, the deepest water harbor on the US East Coast (the Port of Virginia), as well as a massive shipbuilding operation in multiple locations, including the highest employer in Hampton Roads (Huntington Ingalls Newport News Shipyard)
Home to prestigious public universities where those living in state get lower tuition rates, including Christopher Newport University & William & Mary (ranked # 6 & #54 in Regional Universities South & National Universities, respectively, by US News & World Report as of 1/2/25)
Relatively low tax rates in many of the counties that are growing
Population growth in the majority of cities/counties in Hampton Roads
What Other Factors Beyond Typical Real Estate Market Statistics in the US Contribute to Positive or Negative Market Conditions?
The inflation rate of the US Dollar has a high impact on the short and long-term rate of home appreciation. High rates of inflation (those greater than 2%) boost appreciation in the short term, but also tend to push interest rates up (& once interest rates are pushed high enough, it reduces appreciation), as mentioned in more detail on my mortgage interest rates page.
The federal funds rate (which indirectly impacts mortgage interest rates more than any other factor, along with the federal funds rate projections) which are geared towards curbing inflation, is another major factor impacting appreciation.
The federal funds rate projections (see latest under "projection materials" PDF or HTML view here) also has a substantive impact on the rate of appreciation. Here are those projections along with some factors that impact it as of 12/18/24 directly from the FED:

Image courtesy https://www.federalreserve.gov/monetarypolicy 

Image courtesy https://www.federalreserve.gov/monetarypolicy
What Other Factors Contribute to Variance in Market Conditions within Hampton Roads?
The following vary widely within Hampton Roads & are strong contributing factors to values:
Crime ratings
Tax rates
The majority of declines by population were in relatively higher tax rate cities, and most growing cities had relatively lower tax rates than those cities that were declining in the chart below.

Population Growth

Individual market factors in graph form:
Median Sales Prices in Hampton Roads (Overall)
Seasonal Trends:
Sales prices in Hampton Roads (the Virginia Beach Metro Area) tend to be lowest in January and highest from May-August (especially June).
Macro Trend:
Sales prices in Hampton Roads have climbed (or stayed relatively the same) yearly since 2014.
(link for mobile view for 1st graph below)
Longer range w/ seasonal trends to 2021 per REIN MLS (the primary MLS in Hampton Roads):

Our relatively low prices, below even the national prices, help insulate us against nationwide market downturns, & with all the infrastructure present & things to do in the area, position us well for the nationwide & global shift to remote work:

The Virginia Beach metro area, the higher light green line below, is slightly above average among metro areas in VA, while the Richmond metro area (the higher magenta line) is higher than the Virginia Beach metro area. Both areas are below the Virginia Average, which is close to the national average.

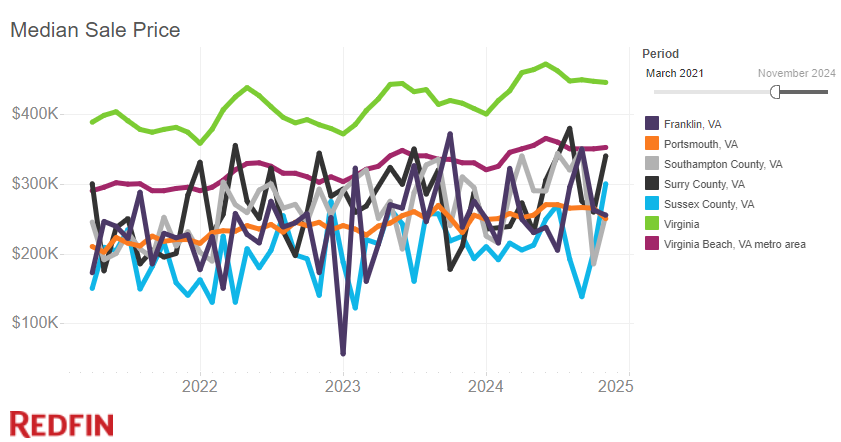
Median Sales Prices by City/County (South Side)
Here's a map of current prices by county on the Eastern South Side (Western Map at Bottom) as of Q1, 2024:

Sales prices on the South Side have followed overall trends in Hampton Roads.
South Side of Hampton Roads Primary Prices along with National & Virginia Prices (Portsmouth & Norfolk are at the bottom, both with declines in population from 2010-2022, both with the highest tax rates among the below locales, and both with higher population densities than any other locale listed) in the picture below:

Outskirts/Adjacent to South Side Prices, as well as Portsmouth:
Outskirts view since 2016:


Median Sales Prices by City/County (Peninsula)
Here's a map of current prices generally speaking on the Peninsula as of Q1, 2024:

Sales prices on the VA Peninsula have followed overall trends in Hampton Roads. Hampton and Newport News trail at the bottom of prices, also having the highest tax rates, lowest population growth from 2010-2022 (negative in Hampton) & highest population densities of these locations:
Peninsula of Hampton Roads Primary Prices along with National, Hampton Roads, & Virginia Prices:
Embedded Version best on a desktop:
Mobile Friendly Version to November 2024:

Median Sales Prices by City/County (Middle Peninsula)
Here's a map of current prices generally speaking on the Middle Peninsula as of Q1, 2024:

Sales prices on the VA Middle Peninsula have followed overall trends in Hampton Roads.
Mobile View to November 2024:

Median Sale Price Per Square Foot
Seasonal Trends:
The median sale price per sq ft in Hampton Roads varies follows the median sales prices, but is more linear. This more linear pattern is due to the fact that those selling homes of higher value are more prone to take their homes off the market during the winter, due in part to factors like education, tending to work with better agents, not wanting to make more concessions, not wanting to extend the market time, and wanting the home to look show ready.
Macro Trend:
Median sales prices per square foot in Hampton Roads have climbed year-over-year since 2012.
Related:
The Impact of Season on Real Estate Photography
(link for mobile view for 1st graph below)
Hampton Roads:
Longer range w/ seasonal trends 2004 to 2022 per REIN MLS (the primary MLS in Hampton Roads):

Homes Available
Seasonal Trends:
The # of homes available in Hampton Roads varies widely by year, but tends to be highest from April to October & lowest from December to February.
Macro Trend:
The number of homes available shrank year-over-year from 2015-2023, before inching up in 2024.
Longer range w/ seasonal trends to 2021 per REIN MLS (the primary MLS in Hampton Roads):

Homes Closed
Seasonal Trends:
The # of homes closed in Hampton Roads tends to be highest from June to July & lowest in January (from December contracts).
Macro Trend:
The # of homes closed in Hampton Roads went up or stayed relatively similar from 2012 to 2021. Since 2021, the number of closings has gone down by a substantive margin, except 2023 and 2024, which were very similar to each other. Sales began trending upward in late 2024 following a reduction in interest rates.
Longer range w/ seasonal trends to 2021 per REIN MLS (the primary MLS in Hampton Roads):

New Listings
Seasonal Trends:
The # of new listings in Hampton Roads tends to be highest from March to July & lowest in December.
Macro Trend:
The number of new listings in Hampton Roads went up or stayed relatively similar year over year from 2012-2019, before coming down in more recent years, with 2023 & 2024 being pretty similar.
Longer range w/ seasonal trends to 2021 per REIN MLS (the primary MLS in Hampton Roads):

Sale to List Price Ratio
Seasonal Trends:
The sale-to-list price ratio in Hampton Roads tends to be highest from May to July & lowest from November to February.
Macro Trend:
The sale-to-list price ratio in Hampton Roads went up or stayed relatively similar year over year from 2011-mid 2022. It's trended downward since then but peak season in 2024 was still over 100%.
(link for mobile view for 1st graph below)
Longer range w/ seasonal trends to 2022 per REIN MLS (the primary MLS in Hampton Roads):

Median Days on Market
Seasonal Trends:
Properties in Hampton Roads tend to have a lower median market time during the middle of the year, with a low typically between May & July & a high between January to February.
Macro Trend:
The median days on market fell or stayed relatively similar every year from 2010-2021. Median market time today is higher than it was in 2021, but not by much.
(link for mobile view for 1st graph below)
Longer range w/ seasonal trends 2009 to 2021 per REIN MLS (the primary MLS in Hampton Roads):

Distressed Units
Seasonal Trends:
Distressed units in Hampton Roads tend to peak in December while being the lowest sometime between April & July.
Macro Trend:
Distressed units in Hampton Roads have been representing a very low % of inventory nationwide in recent years, having fallen dramatically between December of 2010 and 2021, declining most years except some similarities between 2010 and 2012. They've climbed a bit since then, but are still lower than any time between sometime in 2007 & 2020. The reasons why include the fact that many sellers have plenty of equity, the median age of buyers is getting higher, and many buyers facing foreclosure are targeted quickly by buyers in the "We Buy Houses" off-market purchase trend and they often don't understand how much money they are losing by selling to them off market.


Related:


Comments