top of page

Greater Richmond, Virginia Housing Market Trends & History

Apr 14
2 min read

Updated: Jul 30

Richmond, VA skyline from the air including river
Richmond, VA - image by Adam Garrett

Market trends for Richmond, Virginia

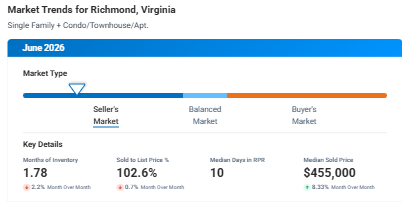
Greater Richmond, Virginia housing market details, including seasonal trends and current numbers on graphs, to help determine when to buy and when to sell based on the market.


Market History & Current Market:


Recurring Annual Market Trends of Greater Richmond Indicating When to List a House & When to Buy based on the market & your own preferences.

Greater Richmond Median Sales Price Seasonal Trends

Hampton Roads Median Sales Price Seasonal Trends
Greater Richmond home prices tend to be high in June (primarily from May contracts) & low in January (primarily from December contracts).
Hampton Roads Median Sold Price Per Sq Ft Seasonal Trends
Greater Richmond home price per sq ft tend to be high in May-July (primarily from contracts that began the month prior) & low in January or February (primarily from December or January contracts).
Hampton Roads Median Days on Market Seasonal Trends
Greater Richmond median days on market tend to be low in May &/or June & highs in January or February.

Greater Richmond Housing Market Seasonal Trends for List Price to Sales Price Ratio
Greater Richmond average % of list price received tend to be high in May-July (primarily from contracts the month prior) & low in January or February (primarily from contracts the month prior).

Greater Richmond Housing Market Seasonal Trends for Active Listing Count
Greater Richmond active listings tend to be high in September-Early November & low in December-February.


Comments

Rated 0 out of 5 stars.
No ratings yet

Add a rating
bottom of page