Weather & Environmental Conditions That Affect Homeownership in Virginia
- Adam Garrett
- Apr 9, 2024
- 12 min read

Below, I cover a wide variety of weather & environmental risk topics in alphabetical order, including maps of Virginia, the US, and close-up views of parts of VA.
This guide forms an integral part of my area guide & Factors to Consider to Help Determine Where to Find Your New Home.
Environmental Factors:

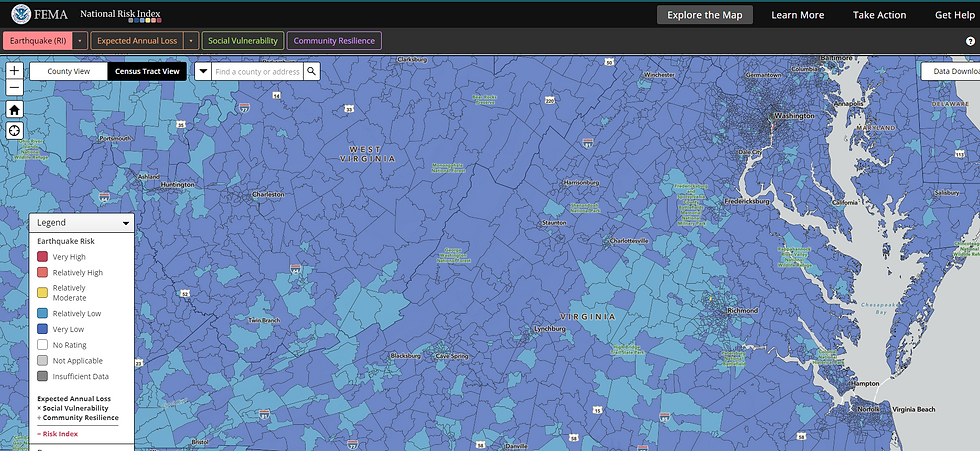
FEMA's Composite Weather Risk Index
FEMA has created a composite weather risk index of expected annual loss * social vulnerability/ community resilience. They have done that across a wide variety of potential weather-related hazards. There are areas of SE VA that range from the very low zone (i.e. Surry, Petersburg, & Williamsburg) to the relatively moderate zone (i.e. Newport News & Virginia Beach). No states on the Golf Coast or the East Coast south of VA can make such a claim. All those states have at least 1 city or county that's relatively high or very high.
Here's the VA map from FEMA:

Here's the US Map from FEMA, which shows just how well VA fares compared to the other parts of the US Coast:
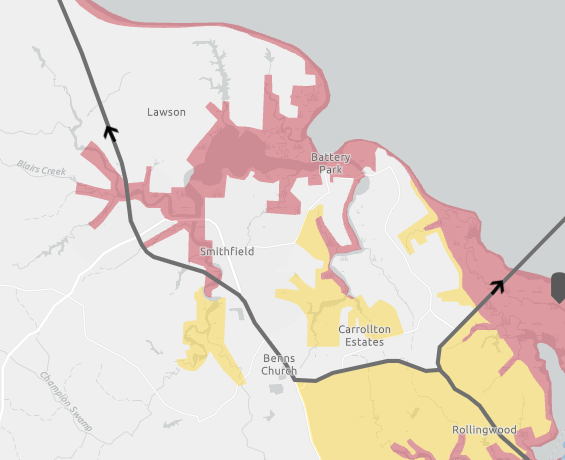
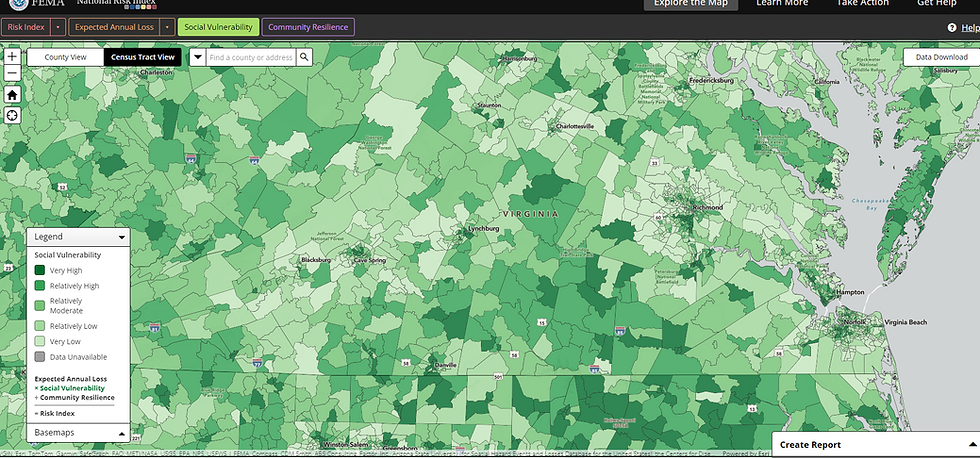
When you break things down further into census tracks, you definitely get a better idea:

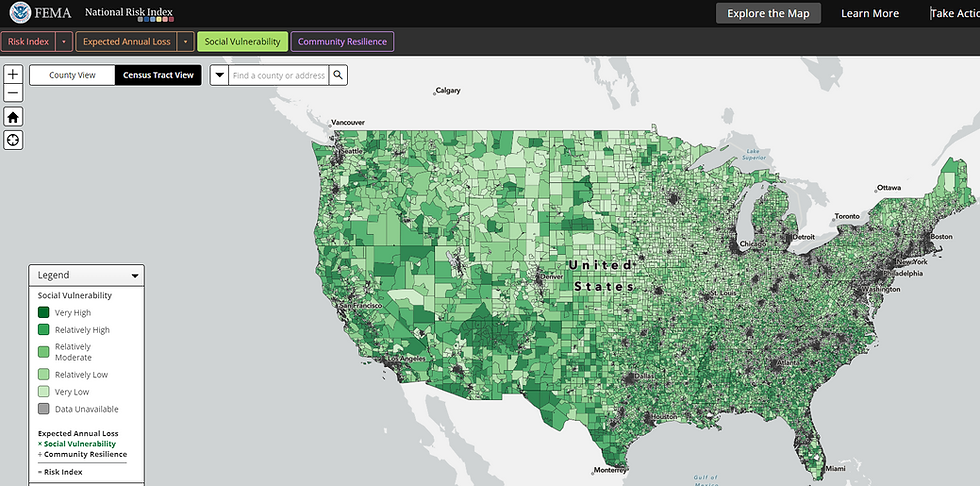
Here's that same view, spread throughout the US, showing VA superior to states south of it and in comparison to all western states:

Keep in mind though, that even in a "relatively high" census tract, some areas may be better off than other census tracts with "relatively low" rating. For instance, I live in a "relatively high" census tract in part because the specific location with the tract is well insulated from some of the very negatives that pull down the tract as a whole.
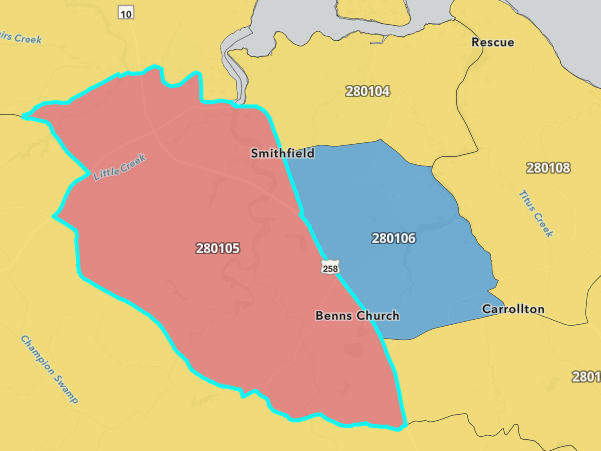
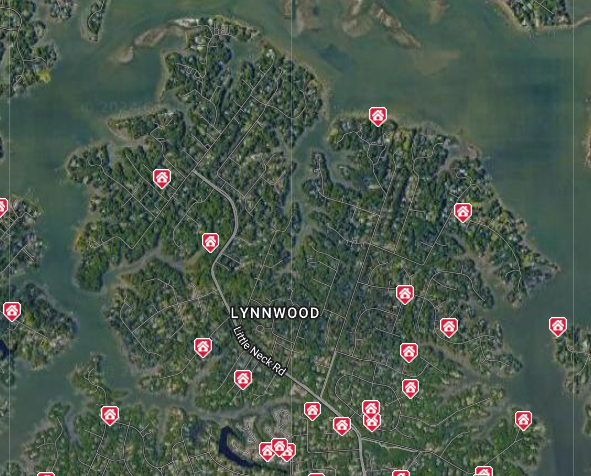
Here is a zoomed-in hurricane evacuation zone
Here are the relatively high indices in my tract:
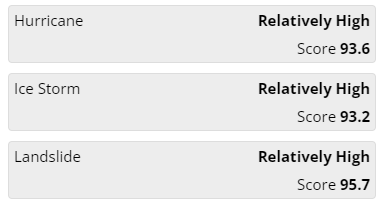
However, I'm not in an AE or X-500 flood zone, not in a hurricane evacuation zone, have minimal threat of landslides occurring, and have no trees on or adjacent to my property that could come crashing down on the house. In addition, I live less than half a mile from a hospital, so if a power outage were to occur, my area would likely be some of the first to receive power again. Likewise, if trees were to come down on roads, my area would likely be some of the first to be cleared.
FEMA's Composite Expected Annual Weather Loss
Unsurprisingly for most, the locations closest to the coast typically have some of the highest risks of loss due to weather:

When compared to the rest of the SE Coast, we're doing relatively well:

When compared to the West Coast and many parts of the center of the country, we're also doing well:

One element that's also interesting is that the risk isn't universal whatsoever even very close to the coast. It can be a bit confusing though. There are some cases where the risk is low in a tract because there aren't many homes or other construction in that area and/or the structures present are low cost.

That's not always the case though.

In the above example in Virginia Beach, the low weather loss is not for lack of high-end homes in that location either, with the 2 homes that sold in the top right each selling for over $1,500,000:
If we compare the above to the hurricane evacuation zone map, we see that the area has lower risk than some of the surrounding areas, in blue (Zone D) below to signify the 2nd to lowest risk zone :

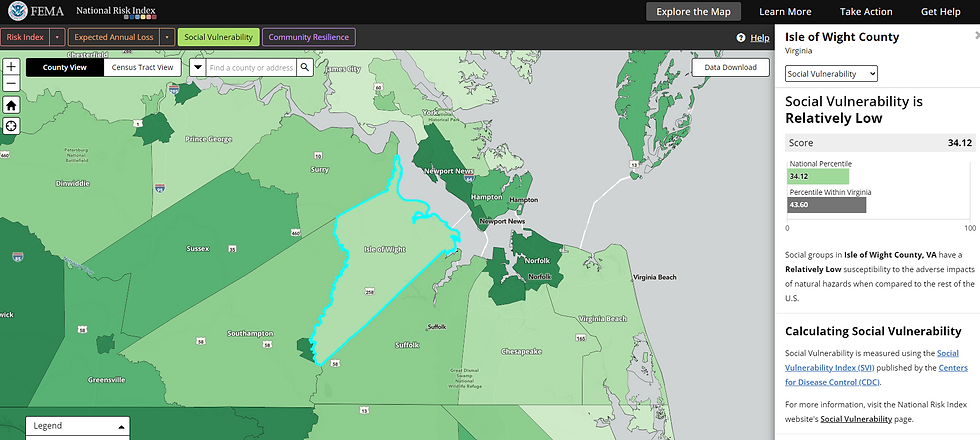
FEMA's Composite Social Vulnerability
'
FEMA's Composite Community Resilience


Air Quality & Sickness by Area
Best Air Pollutant Map Options by National Institute of Health
Best Air Pollutant Particulate Matter Map of US by County:

Map of Particulate Matter by County/City in VA:

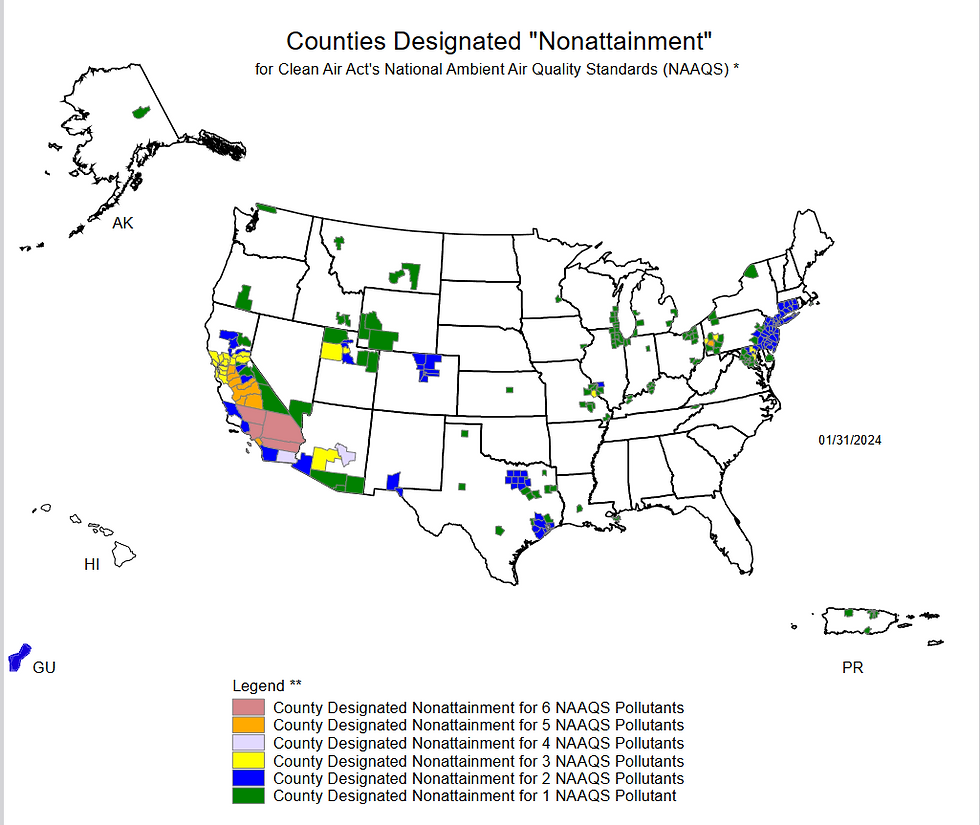
Map of Failed Air Quality Standards (NAAQS) Locations:

Spreadsheet of most polluted cities in VA (though many cities missing from their rankings)

Within SE VA,
Richmond is #10/42 above
Chesterfield is #14/42
Petersburg is #17/42 below

Within SE VA,
Hampton #29/42
Mechanicsville #31/42
Norfolk #42/42


See more covering a wide range (i.e. sickness & comparing local cities/counties) on the subject here:
Dangerous Animals & Insects
See termites section as well.
Whether you're considering deer on the road, bear, sharks, mountain lions, Florida panthers, alligators, American crocodiles, gray wolves (though no lethal attacks have been recorded), brown recluses, scorpions, or venomous snakes, bees, or more, there are a lot of animals, including insects, amphibians, insects, & arachnids, that can kill you. Notably some are missing in the map below, i.e.
deer from vehicle accidents
Man of War
Sea Wasps

Drought Map 2000-Present & Precipitation Map


Earthquakes
Earthquakes aren't much of an issue in Virginia with relatively rare exceptions (i.e. Threechopt).
That can't be said throughout the rest of the US, & even the East Coast has a hotspot in South Carolina:

Elevation
Elevation courtesy Southern Appalachian Vitality Index:


Fishing & Shellfish
Takemefishing.org has a resource that shows boat ramps, marinas, pictures of fish caught nearby submitted by users, the ability to filter waters by species, & more.

VMRC has a resource that states the dividing lines between freshwater & saltwater fishing in VA. That's helpful for licensing and for fish to go for.
Here is a solid resource for deep-sea fishing from northern NC to Maine, showing where the highest concentrations of certain species were from 2010-2019:

Flood Zones
A home's location in a flood zone can cost anywhere from hundreds to thousands of dollars annually in flood insurance, not to mention the anxiety inherent in every storm that comes where you wonder how your home will fare, in some cases making preparations "just in case". While I don't recommend that all rule out flood zones, it's not a bad idea for many. Also keep in mind that X500 zones in hurricane evacuation zone A are much more likely than elsewhere to become AE zones (where flood insurance becomes required on a mortgage and where I still recommend it on a cash deal).
How to See a Flood Zone with Matrix MLS (the primary MLS portal brand used in SE VA & in many other MLS around the country)
Flood Map (type in address at top)
Information from FEMA on Flood Maps
Many are familiar with coastal flooding in VA, but flooding can be an inland issue as well. Here's a Riverene flood map of VA from FEMA.
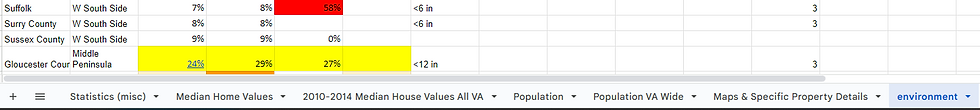
Counties in SE VA range from the very low zone (i.e. Surry, Petersburg, Suffolk, New Kent County, Charles City County, James City County, Middlesex County, Kin & Queen County, King William County, Richmond County, Westmoreland County, Prince George County, Dinwiddie County, & Williamsburg)
to the relatively moderate zone (i.e. Norfolk, Virginia Beach, Hampton, Chesapeake, Mathews, Portsmouth, Richmond) VA:

Here's a US Riverene flood map from FEMA:

Here's what most people think of when they think of VA flooding, a coastal flood map from FEMA, where VA enters into relatively high territory in Accomack County on the Eastern Shore:

Here's that same map on a national scale from FEMA:


See more SE VA cities/counties on the SE VA City Information & Real Estate Property Info linked spreadsheet in the environment tab.
Here's an example of my father's house (from a Matrix portal view as part of a home search integrated into the listing) in a flood zone (his primary residence & mine starting my freshman year of college in 2004 when back home from school, now his rental after downsizing) & an example of how some looking for waterfront may not want to rule out flood zones completely. It was his favorite property in VA prior to purchasing it:
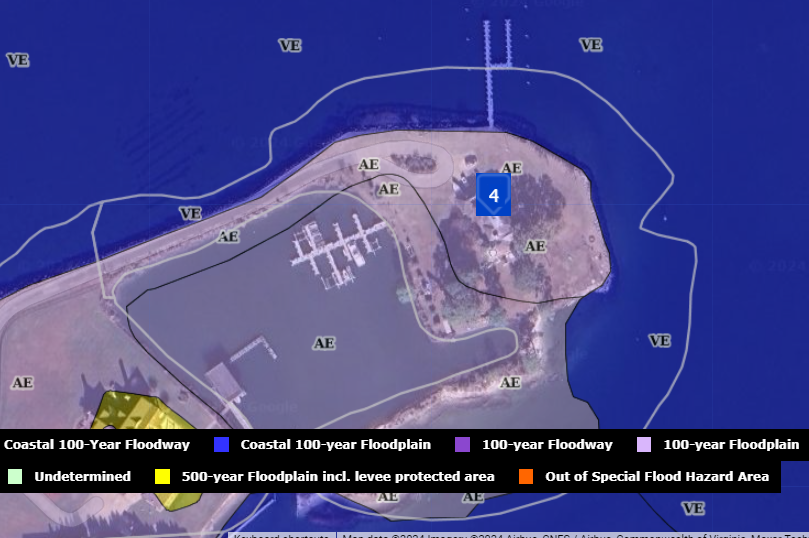
image courtesy MLSMatrix.com
Gardening & Grass Zones
Here you can get an idea of growing season for your garden and grass from Virginia Places:

You can type in zip codes in the map below:

Humidity
While humidity doesn't mean much to most without also knowing temperature (see temperature below), here's a solid humidity map I found published by Forbes:

Here's a ranking of VA cities/counties by humidity level. Surprisingly, some SE VA cities/counties rank low % humidity levels, in the bottom 20 (which is great news for those considering SE VA), like Richmond, Portsmouth, Norfolk, Surry, Hampton, and Isle of Wight County.
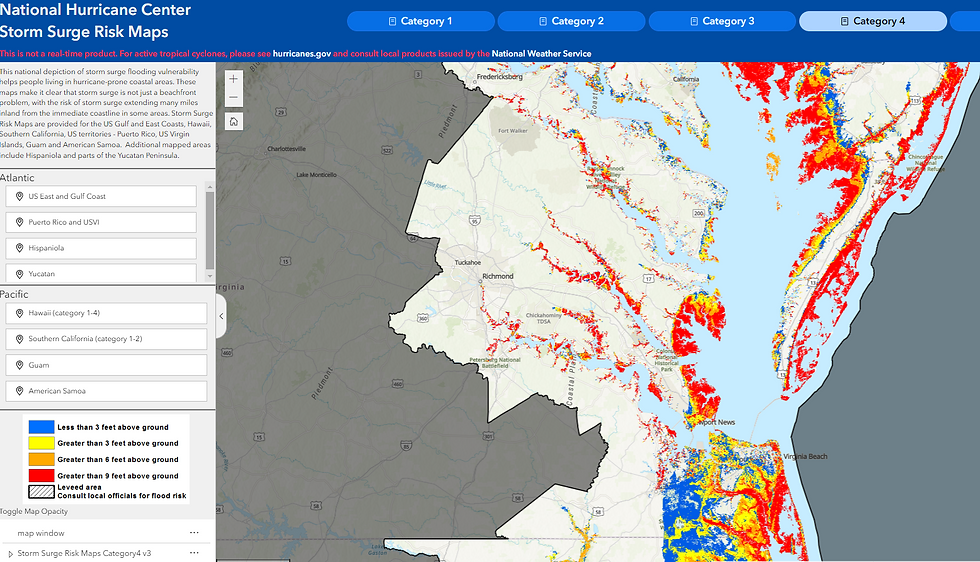
Hurricane Evacuation Zones
Hurricane evacuation zones are where properties, even those not in flood zones, are evacuated (sometimes with mandatory evacuations) based on the zone they are in. It's dangerous to remain in one even if there's no chance that the home itself will get flooded because emergency response teams could have difficulty getting there in the event of an emergency, such as a fire truck or an ambulance.
VA Map (other states below courtesy VDOM):

Images below courtesy VDEMGIS

The white section above would seem to paint a darker picture than reality, but it simply means that you should look more closely.
Here's how that looks zoomed in if a category 1 storm hit:

Here's how that looks at category 4:
The statistical probability of a category 5 storm hitting VA is low, thus why VA & states north of it aren't included on the category 5 map below:

County by County Map for US (2020)
VA above
GA (Bryan, Chatham, Glynn, McIntosh)
For Adam's clients:
If creating a search with me, ask me about the search templates I've spent dozens of hours creating to avoid hurricane evacuation zones in case you'd like to avoid hurricane evacuation zones in SE VA. I'm unaware of any other agents in SE VA that have spent that kind of time to create a similarly detailed way to avoid hurricane evacuation zones.
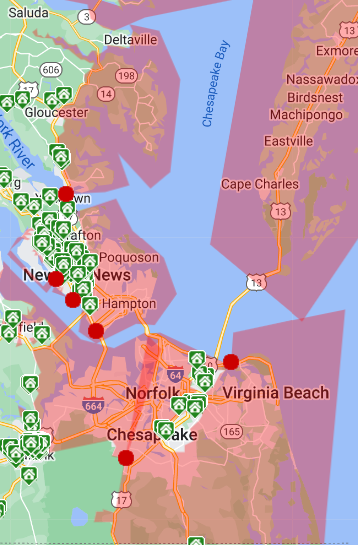
Power Outage Map
While the data only pulls from 2018-2020, which is a significant limitation here is the best power outage map by county that I could find:

Zooming into the area around VA, here is how that looks:

I also have a section on "How to Prepare for a Power Outage in Extreme Cold" in my article Prepping Homes For Extreme Cold.
While there is radon in every zone, those in yellow have the lowest risk of issues.
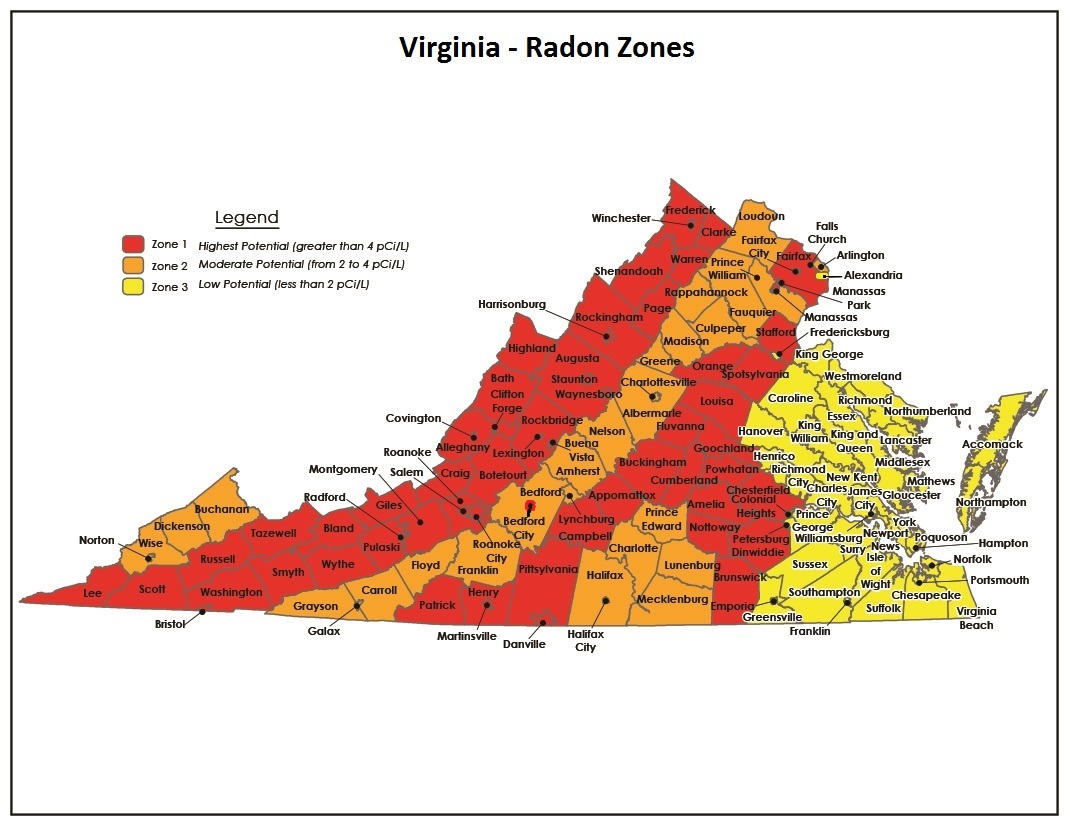
Image courtesy VDH
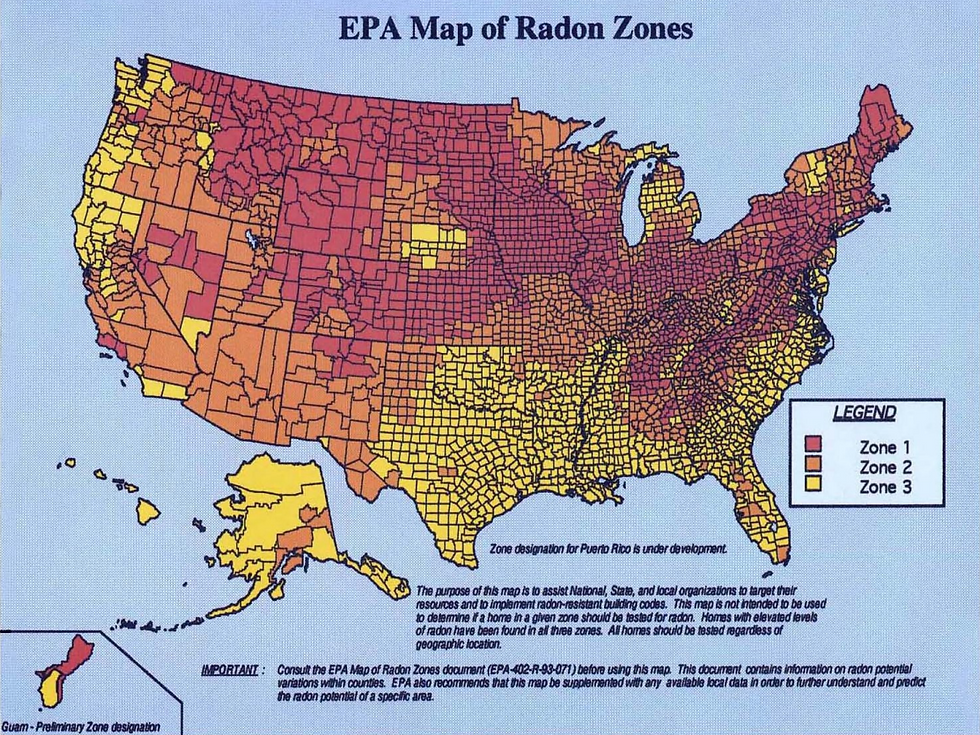
Image courtesy EPA
For Adam's clients:
While I'm not certified in any capacity to test for radon, my clients (current & former) are welcome to borrow my Ecosense RadonEye radon tester to use on a property under contract or on their existing home.
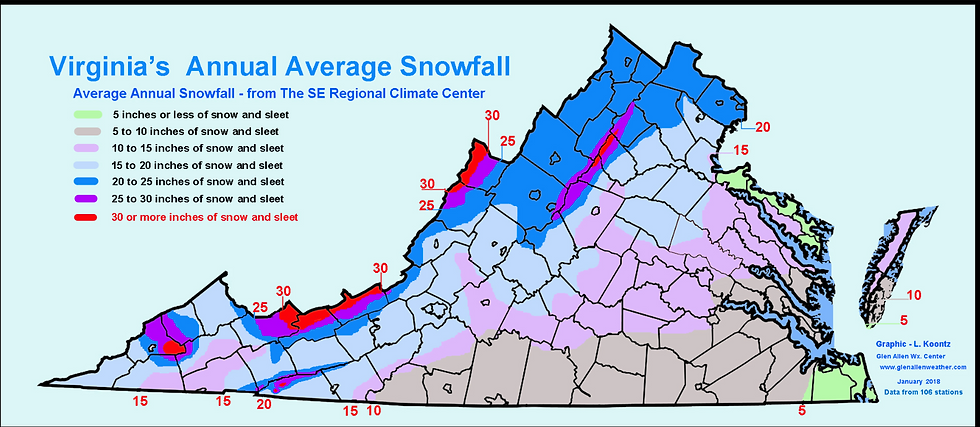
Snowfall Map
Snowfall Map courtesy GlenAllenWeather
There are pros and cons to snowfall.
Cons:
More accidents on the road
More vehicle deterioration from salted roads including rust issues
Higher cost of heating & higher insulation needs in colder areas
Higher impetus for an attached garage. In mild climate places like SE VA, often garages are used for storage rather than to store vehicles.
More reason to have a significant roof pitch that's more costly
Lower growing season & certain plants that are not cold tolerant that may not survive
Pros:
The beauty of snow
Certain plants thrive with snow & need frost, like cranberries.
Places that snow are more likely to have lower cooling costs in the Summer.
Snow enables a wide variety of winter sports & related activities, like ice skating outside & related sports like ice hockey, snow tubing, dogsledding, ice climbing, snowball fights, going for a sleigh ride with a horse, broomball, snow football, snow rugby, etc. I've personally enjoyed all of those.
Ice skating is much easier to replicate in warm locations than snow skiing. In Hampton Roads, Virginia Beach, Chesapeake, & Yorktown each have year round skating rinks, while others have popped up seasonally such as in Williamsburg & Norfolk. Around Richmond, year round ice skating rinks may be found in places like Richmond, Chesterfield, and Glen Allen.
Perhaps the most popular sport that snowfall enables is downhill skiing. When considering places with warm water at least 5 months a year, SE VA has the closest proximity in the US to go from the ocean to a mountain with recreational downhill skiing. North Carolina has some good downhill skiing too, but you'll need to travel significantly farther to get there from the ocean.
Temperatures
Mean Daily Average Temperature from Climate Atlas of the United States
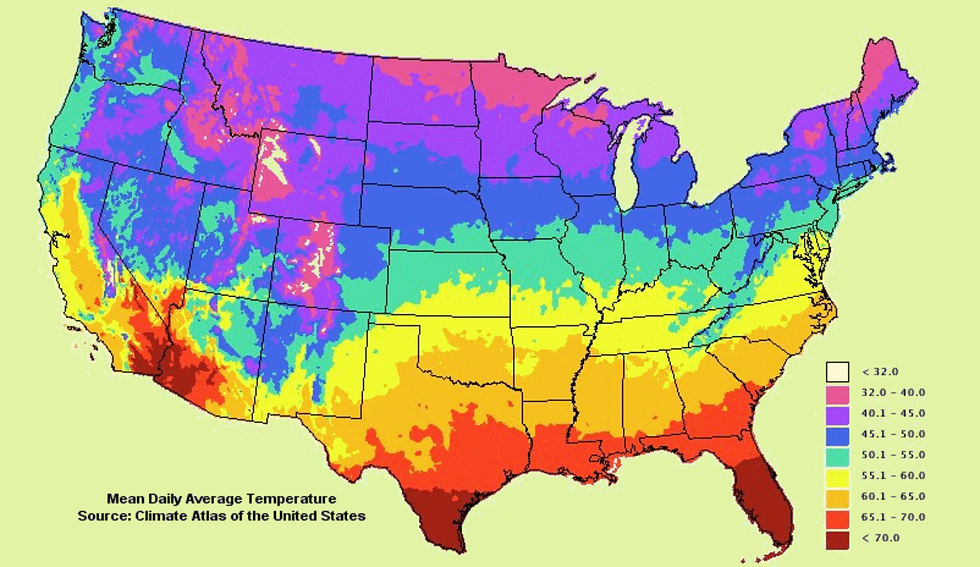

I saw the above and wondered about July. I was right to, since it's the hottest month of the year. Here are some metrics for July per NOAA:
Year | Highest Temp City/County July Average | Highest Temp Counties | Lowest Temp City/County July Average | Lowest Temp Counties |
Averages: | 80.77 | Norfolk | 69.24 | Highly County |
2023 | 81.3 | Norfolk & Portsmouth | 69.5 | Grayson County |
2022 | 81.2 | Norfolk & Portsmouth | 69.7 | Highland County |
2021 | 79.9 | Norfolk | 68.3 | Grayson County |
2020 | 83.6 | Norfolk | 70.7 | Grayson County |
2019 | 81.3 | Norfolk | 69.6 | Grayson County |
2018 | 78.8 | Norfolk | 68.9 | Highland County |
2017 | 81.6 | York County | 69.3 | Highland County |
2016 | 81.6 | Norfolk | 71.3 | Highland County |
2015 | 80.0 | Norfolk | 69.3 | Highland County |
2014 | 78.4 | Hopewell City | 65.8 | Highland County |
In a year where the top high was very close to the average top high for the last 10 years, 2002, here's what that looked like on a map:

Here's the spreadsheet for a county by county view.
If you have 1.5+ floors, a single zone, & >3°F temperature differential between floors:
You may or may not be aware, but there are ways to reduce the discomfort of this scenario & reduce the disparity present in your home beyond adding insulation & otherwise. The optimized temperature setting is typically more like 68 if in the Summer & there is a large temperature differential between downstairs & upstairs & you have a single zone. In this case if you have a 1.5+ story home you also may want to adjust your vents if you haven't already to be more open on the higher floor(s) & less open on the lower floors).
That said, if you've used some of the above methods & it's still a high temperature differential between floors, you may want to take a look in your attic to see the insulation levels. If Adam's your agent, ask Adam to borrow a ladder if you have scuttle access only & you don't have a ladder; he also has a thermal imaging camera etc. If adding insulation is warranted, here's a handy map from EnergyStar, w/ SE VA being in zone 3A & 4A where R49-R60 is recommended in the attic:

This Site by Climate Impact Lab has a Number of Excellent Maps, Including but Not Limited to:
Average December-February Temperatures:

Average June-August Temperatures:

For a Heat Wave Map, Washington Post has a Great Option:

Termites
Homeguide has a good termite inspection cost guide.
Throughout VA, we are in an area where termites are considered to be moderate to heavy:


Coastal, Chesapeake Bay, & Tributary Water Temperature
One of the most common water temperature elements that people want to know is water temperature averages, whether for fishing or playing:


Image courtesy Surf Forecast
The Gulf Stream flows close to the Outer Banks of North Carolina before going back out to the Atlantic, giving VA the beauty of water that's warmer than it would be otherwise, easy access to warmer waters with a drive to the Outer Banks when a hurricane isn't coming (for most, that is), & not nearly the hurricane & tornado threat of North Carolina's east coast that contributes significantly to East North Caorlina's overall environmental risk scores I show at the top of this article.
That's one of the top reasons why the states south of VA have more issues with hurricanes, tornados, & floods. While it doesn't flow directly by VA, its impact is still felt in giving us warmer water than our West Coast & NE neighbors on the coast. Above Virginia on the NE coast, away from the jet stream, the temperature rapidly deteriorates in a way not present on the West Coast.

In addition, our Chesapeake Bay and its tributaries tend to heat up faster than the ocean every year. Look at the difference between 64.8 degrees on the bay side and 51.8 degrees on the ocean side near the central top 2/4 measurements below in this 4/16/24 measurement:

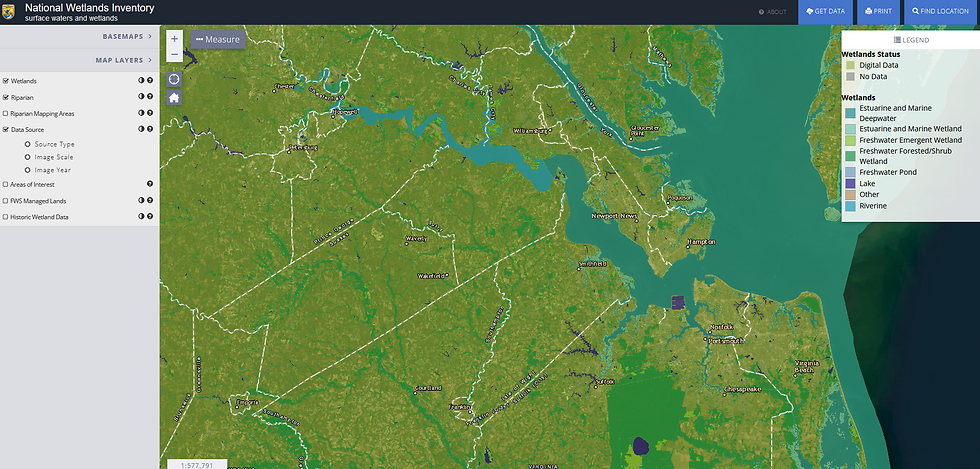
Wetlands Map
If you plan on making changes to your property especially, whether you want to install a tennis court, addition, or widen your driveway, a location near wetlands, especially salt water wetlands, can put an expensive damper on your plans if you really want to complete that project. With saltwater wetlands (marine) you'll typically need a 100' buffer between the wetlands zone and any building.
Here's a US map for locating wetlands. Here's how that looks locally:
Wind Map

Wind Map courtesy Wind Exchange

Homes in SE VA vary in terms of the wind ratings needed in the building code:

Wind Chill Map


Comments